The S&P 500 (SPX500) Trading Today plunged with unusually strong momentum … and The U.S. equity market suffered a sharp reversal today. Up until midday, things were relatively calm, but a sudden shock from Washington rattled confidence and triggered a cascade of selling across sectors. The day’s action left few places to hide, with technology names particularly punished, while only a handful of defensive or value names offered mild respite.
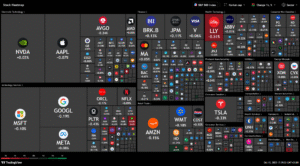
Looking at the heatmap for various intraday windows, the shift is obvious: early in the day, there was a mix of subtle green and red, but over time red dominance spread across nearly all sectors. Tech (semiconductors, hardware, software) was hit hardest. Mega-cap names such as Apple (AAPL), Microsoft (MSFT), and Amazon (AMZN) were deep in the red, pulling down broader index weight. Tesla (TSLA) faced another down session. Meanwhile, some relative strength appeared in consumer staples, utilities, and certain healthcare names … but the strength there was modest compared to the pain in growth names.
The pattern suggests that investors rotated away from high-beta / high-valuation tech exposures and into safer havens, at least temporarily. That rotation, combined with stop cascades from break of key technical zones, magnified the drawdown.
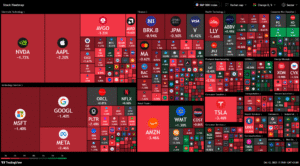
Chart Breakdown : Hourly, 2-Hour, 4-Hour Views The Technical Story
1-Hour Perspective : Momentum Burst to the Downside
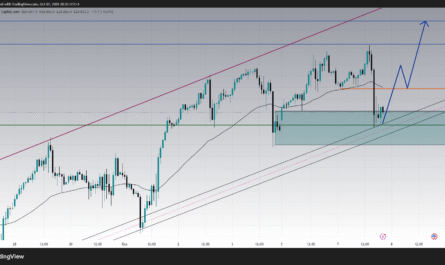
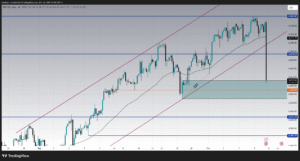
On the 1-hour chart, the S&P had been trading in a gentle upward or sideways consolidation, with support around 6,674 (a prior floor) and resistance near 6,762. Today’s action violently breached downward from that structure, opening up a sharp vertical move lower. The price dropped through 6,674 decisively and landed around 6,633 in the latter half of the session.
That breakdown was accompanied by strong bearish momentum signs. The MACD histogram turned deeply red as the MACD line crossed below its signal, showing that intraday momentum shifted aggressively in favor of sellers. The severity of the move suggests that many stop-loss triggers (especially among momentum traders) were hit, accelerating the fall.
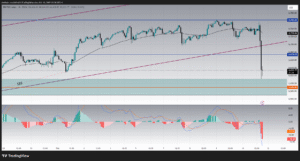
As of now, the immediate resistance zone lies between 6,674 and ~6,700, where any bounce would face selling pressure. Below, the next significant target zone is between 6,589 and 6,527, drawn from past accumulation and demand zones on the longer timeframe charts.
2-Hour Perspective : Market Structure Unravels
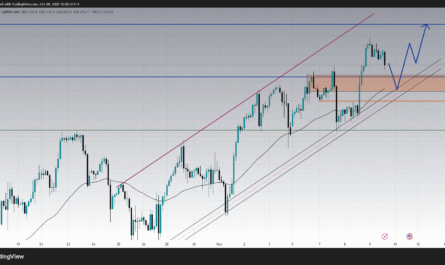
On the 2-hour timeframe, the trend prior to today had been moderately bullish … characterized by gradual higher highs and higher lows. But today’s breakdown represents the first real structural violation. The ascending channel or trend support was violated, and price is carving a lower low.
The Stochastic oscillator, which had been showing overbought conditions earlier, crossed downward and is now trending toward oversold territory. Yet it has not hit extremes, meaning that a bounce or relief rally is possible if selling momentum cools near the support band.
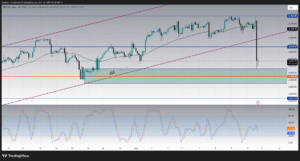
As long as the price remains below 6,674, the new bias tilts toward continuation lower rather than a clean rebound. Even a bounce would likely be constrained unless buyers can reclaim that region with conviction.
4-Hour / Macro View : The Bigger Picture Shift
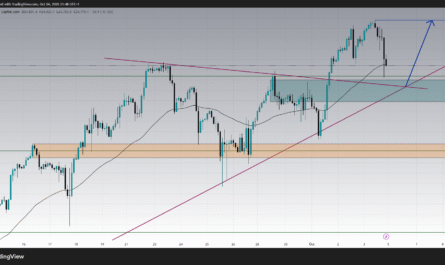
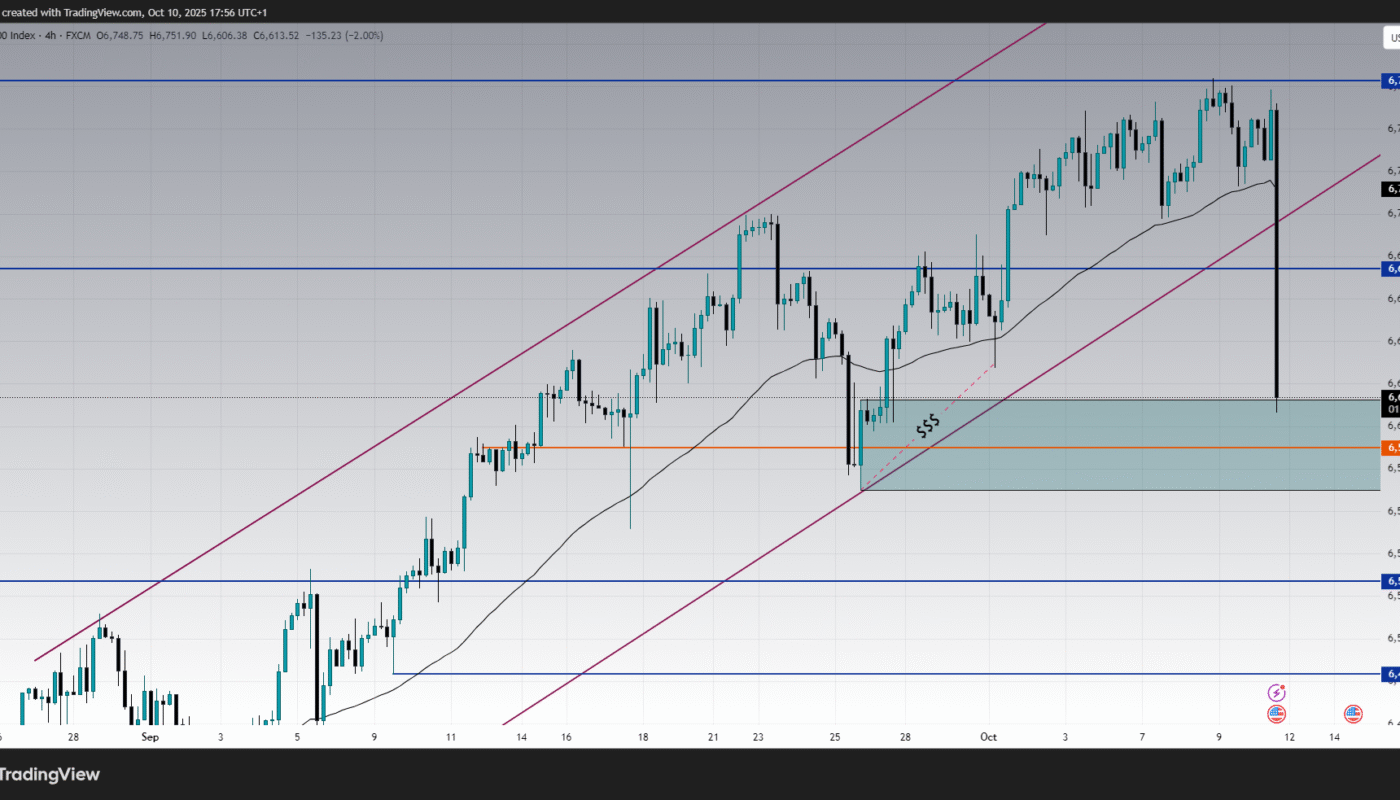
The 4-hour chart reveals the broader structural context. Since mid-September, the S&P 500 had been contained within a rising parallel channel (the price respecting the upper and lower boundaries). That channel has now been breached downward. The breakdown is not a subtle pullback … it is a substantive shift in trend behavior.
The RSI on the 4-hour timeframe offers additional clues. It had shown a bearish divergence: while price was making new highs or holding high ground, the RSI was failing to confirm and was drifting lower. Today’s sharp drop pushed the RSI well down (into the 30–35 zone), confirming that momentum has turned decisively negative.
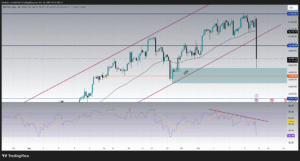
Thus, structurally, the market is no longer dancing inside its previous bullish regime — it’s entering a new phase, with the 6,589–6,527 zone as the next meaningful magnet of support. If that zone fails, we could see a deeper retracement or a shift to a trend lower.
What Drove the Selloff ? Macro & Market Context
Tariff Shock & Trade Tensions
The dominant headline was a renewed flare-up in U.S.–China trade tensions. President Trump announced that he was considering a “massive increase” in tariffs on Chinese goods, following China’s own restrictions on rare earth export controls. He also canceled or called into question a planned meeting with President Xi, citing China’s hostility.
This surprise escalation rattled markets. Investors feared that a new wave of tariffs could further strain global supply chains, raise costs for tech manufacturers, and worsen growth prospects especially in sectors heavily reliant on China (semiconductors, electronics, consumer hardware, batteries). The semiconductor index fell ~3.7% today.
In response, stocks that depend on global manufacturing, exports, or raw materials were punished harshly. The tech sector – particularly chipmakers and AI-related names – bore the brunt of the selling.
Flight Into Safety, Yields, and the Dollar
Amid the equity selloff, yields on U.S. Treasuries declined (prices rose), reflecting a shift toward safer assets. The 10-year yield dropped as money flowed out of equities. Simultaneously, the U.S. dollar weakened, a sign that currency markets also viewed this as a risk event.
This “flight to safety” dynamic further pressured equity valuations, particularly for growth stocks whose valuations are highly sensitive to discount rates.
Valuation Stretch & Sentiment Fragility
Prior to today, many stocks – especially in the tech/AI domain – had enjoyed strong runs upward, pushing valuations into extended territory. Some momentum investors and institutional players had already been warning about the fragility of a market that had priced in near-perfection.
So when a shock (like tariff escalation) hit, the market had little room to absorb it. The sentiment tilt quickly turned negative, triggering profit-taking and forced liquidations.
Geopolitical & Supply Chain Risk Amplifiers
China, meanwhile, has also taken aggressive steps. Beyond export restrictions on rare earths, China reportedly initiated antitrust investigations into Qualcomm and stepped up scrutiny of Nvidia shipments. New York Post Further, Beijing announced “special port fees” on U.S. ships, matching U.S. tariffs in a tit-for-tat move.
These escalating retaliatory measures add fuel to the risk narrative: this is not a one-off tariff threat but a broader escalation in U.S.–China trade warfare.
How Investors Reacted (Behavior / Psychology) :
With the tariff news catching markets off guard, a rapid shift in psychology occurred. The breakdown triggered stop-loss clusters among momentum traders, which caused further drops. The speed and breadth of the decline suggest that algorithmic and programmatic strategies amplified the move.
Many long-biased investors likely paused or reduced exposure quickly. Some may have raised cash or hedged positions. Others may await clarity or entry points near demand zones.
On the upside, short-term traders may try to fade the extremes – pick low-risk bounces – but the caution is that any bounce must overcome strong resistance bands to signal a trend reversal.
In sum: it wasn’t panic, but rather a sharp re-pricing of risk based on unexpected policy escalation. The market is now digesting a new risk regime.
Outlook & Forecast : What Comes Next?
Bullish / Recovery Scenario
If the S&P 500 can find support in the 6,589–6,527 zone and hold it, buyers may step in and generate a recovery attempt. A strong rebound might push the price back up toward 6,674–6,700. If that resistance is cleared, upside toward 6,760–6,800 might re-open, though likely with significant retesting and volatility.
In that scenario, confirmation would require:
-
RSI or momentum indicators turning up from oversold levels
-
MACD / histogram recovering toward neutral or positive
-
Strong volume backing moves
-
No fresh surprise headlines aggravating trade tensions
If those line up, the market could reclaim some calm and re-enter a range or trend-like regime.
Bearish / Continuation Scenario
If support at 6,589–6,527 breaks, the path down looks open. The next logical target lies lower, potentially near the 6,483 region or edges of prior liquidity clusters. That would signify a deeper retracement and shift into a medium-term downtrend.
In that scenario, expect sustained volatility and a choppy descent, with possible reaction rallies that fail at resistance.
Neutral / Choppy Range Scenario
Given the magnitude of today’s move, the market may spend several sessions consolidating between 6,530 and 6,670. Traders may oscillate within that band while waiting for clearer signals either from macro data or trade-de-escalation news. This could lead to back-and-forth action until a directional catalyst emerges.
What to Watch Closely (Key Signals & Levels) :
-
Reaction in the support band (6,589–6,527): whether price stabilizes, forms bullish reversal patterns, or gives way
-
Volume behavior: weakening volume on further declines may suggest exhaustion
-
Resistance holds: particularly 6,674–6,700 – if price can break above, it signals buyer strength
-
News flow / tariff developments: any softening in rhetoric or breakthrough in talks could spark relief
-
Economic data / Fed commentary: especially inflation, industrial production, PMI — all may get magnified in this environment
-
Sector leadership: whether defensive sectors, staples, utilities, or health outperform will show rotation bias
Conclusion : A Technical Breakdown Fueled by Policy Shock
Today’s price action in the S&P 500 was a dramatic reminder that political and policy shifts can override charts and sentiment when markets are already in delicate balance. The surprise tariff escalation broke investor complacency. Combined with stretched valuations and fragile optimism, the result was a swift and deep decline across sectors, particularly tech/growth names.
From a technical perspective, the breach of 6,674 support marks a structural shift. We are no longer inside the prior upward consolidation channel. The 6,589–6,527 zone has become key support; whether it holds or fails may determine the near-term regime (relief bounce vs. further decline).
From a macro angle, the escalating U.S.–China trade tension, retaliatory moves by China (port fees, antitrust probes), the government shutdown, and yield/dollar swings all reinforce the risk narrative.
For now, the best path is caution. Long exposures should be managed tightly with hedges or stop discipline. Wait for confirmation signals before re-engaging. If support holds and we see momentum return, a rebound is possible. But if this zone breaks, further downside is on the table.