The Nasdaq US100 Index Today Trading showing hesitation after recent strong momentum. The index pulled back slightly around the 25,070 level following an impressive rebound earlier this week.
While the broader sentiment remains constructive, today’s session reflected sectoral rotation, with chipmakers like NVIDIA (NVDA) showing strength, while mega-caps such as Apple (AAPL), Microsoft (MSFT), and Tesla (TSLA) weighed on the index.
Heatmap Overview : Divergent Performance Across Tech Giants
The Nasdaq 100 heatmap reveals a clear divergence within the technology sector:
-
NVIDIA (+2.77%) led the market with strong gains after analysts raised price targets following continued AI chip demand.
-
Apple (-1.03%), Microsoft (-0.54%), and Google (-1.01%) were under mild selling pressure as investors took profits ahead of the upcoming U.S. inflation data.
-
Tesla (-1.86%) fell for the second consecutive session as investors expressed concerns about delivery numbers and margin compression.
-
Amazon (-0.89%) traded lower despite stable e-commerce sales expectations, reflecting the broader pressure on growth stocks.
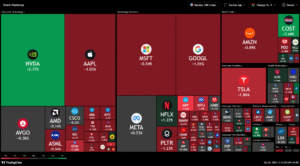
Meanwhile, defensive and retail names like Costco (+2.68%) and healthcare stocks such as AstraZeneca (+0.7%) provided stability, offsetting some of the losses in tech.
This rotation suggests short-term profit-taking in high-beta names while capital temporarily flows into defensive sectors.
Technical Analysis : NASDAQ 100 (US100)
Let’s break down the multi-timeframe structure visible in the attached charts (1H, 2H, and 4H):
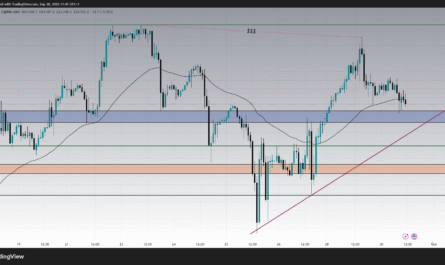
1-Hour Chart (Short-Term View)
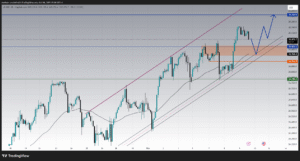
On the 1H timeframe, the US100 remains within a rising parallel channel, confirming that the broader uptrend is still intact despite short-term corrections.
-
Current Price: Around 25,070
-
Immediate Support Zone: 25,021 – 24,968 (highlighted orange box)
-
Next Key Support: 24,788
-
Resistance Zone: 25,150 – 25,250
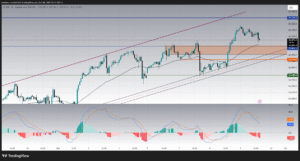
The index bounced strongly from the 24,788 demand area earlier this week, forming a higher low that maintains the bullish structure.
However, today’s candles indicate mild selling pressure as momentum cools down from the 25,150 resistance level.
The MACD histogram shows weakening bullish momentum — the bars have turned red, and the MACD lines are crossing downward. This suggests a potential short-term retracement toward the 25,000–24,950 zone before bulls attempt another upside push.
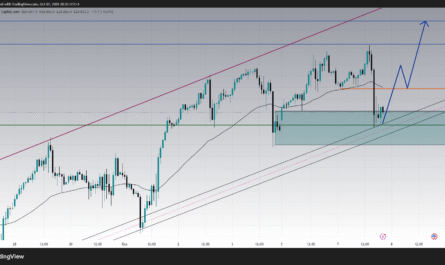
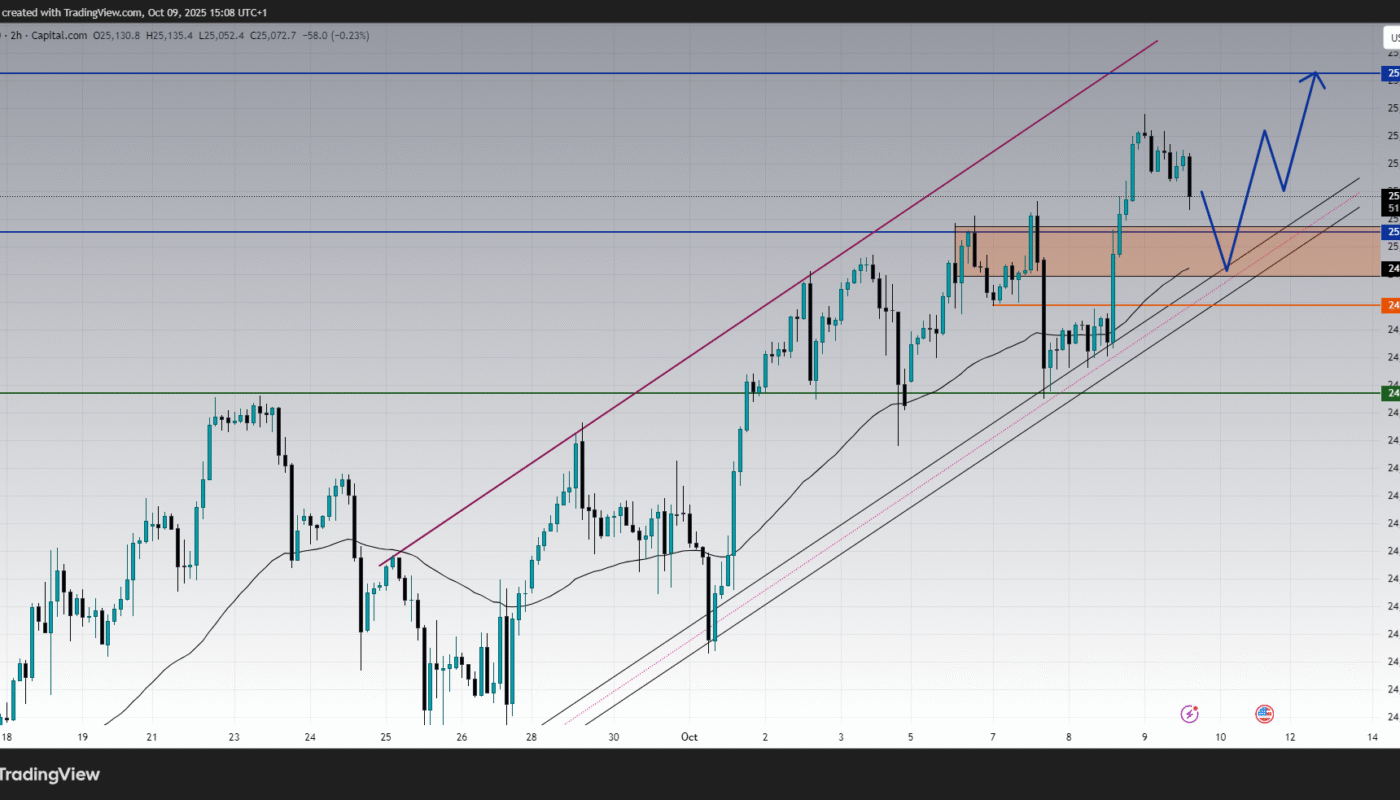
2-Hour Chart (Medium-Term Outlook)
The 2-hour chart provides a clearer picture of the current price consolidation phase following a strong rally from 24,600 to 25,150.
-
The Stochastic oscillator shows a downward cross from overbought territory, but both lines are finding support around the 50 level — historically an area where bulls often regain control.
-
A trendline support from October 2 remains intact. As long as the price holds above 24,900, the bullish bias remains dominant.
-
The bullish scenario would involve a short-term pullback toward the orange support zone (around 25,000) followed by a potential rebound toward 25,250, the upper boundary of the ascending channel.
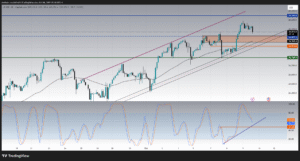
The clean structure of higher highs and higher lows signals that buyers still have control, but are temporarily pausing for profit-taking.
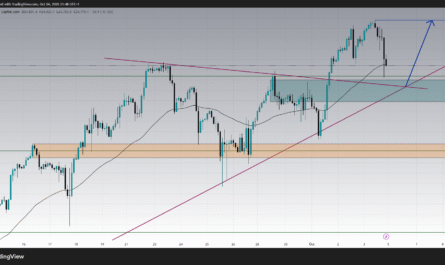
4-Hour Chart (Macro-Structure and RSI Insight)
On the 4H timeframe, the US100’s structure shows the larger bullish channel that has been respected since mid-September.
-
The RSI indicator is forming a symmetrical wedge, with higher lows around 50 and lower highs around 70.
This pattern reflects momentum compression, which often precedes a significant breakout move. -
The 50-period EMA continues to act as dynamic support, aligning with the 25,000 region — adding confluence to that level.
-
The last swing high around 25,250 represents a potential short-term resistance before any attempt to reach higher psychological targets like 25,400.
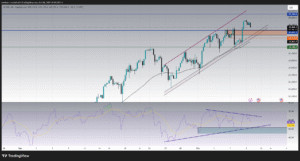
If the RSI breaks above 65 while price remains above 25,000, a bullish continuation would be confirmed, likely targeting new highs within the channel.
Market Context : Fundamental Drivers Behind Today’s Moves
1. Bond Yields and Fed Outlook
The slight weakness seen in the Nasdaq today is partly tied to the rise in U.S. Treasury yields, as traders reassess the timing of potential Federal Reserve rate cuts.
Higher yields tend to pressure growth stocks due to valuation sensitivity, explaining why mega-caps like AAPL and MSFT faced mild pullbacks.
2. Sector Rotation
The rotation visible in the heatmap suggests that investors are diversifying within the index, moving temporarily into defensive assets and value stocks while waiting for clearer macro signals.
The sharp contrast between NVIDIA’s strong performance and Apple’s decline is a prime example of this rotation within the same sector.
3. Earnings Anticipation
Earnings season is approaching, and traders are positioning cautiously. Technology firms are expected to show moderate revenue growth but narrower margins, especially those exposed to AI infrastructure costs.
What Happened Today : Summary
-
The Nasdaq 100 traded in a tight range, hovering around the 25,000 level after early strength faded.
-
NVIDIA’s 2.77% gain offered key support to the index, preventing a deeper correction.
-
Profit-taking in AAPL, MSFT, and GOOGL limited the upside, while Tesla’s 1.8% drop added bearish sentiment.
-
The overall structure remains bullish but consolidating, as traders digest recent economic data and await the upcoming CPI report.
NASDAQ 100 Forecast and Next Move :
Based on both the technical and fundamental outlook, the next potential scenarios are as follows:
Bullish Scenario (Primary Bias)
-
If the index holds above 24,950, buyers could soon regain momentum.
-
A retest of 25,000–25,020 followed by strong volume could lead to a new rally toward 25,250, then possibly 25,400 in the coming sessions.
-
MACD confirmation above the signal line and RSI recovery above 60 would reinforce this view.
Bearish Scenario (Secondary Possibility)
-
A decisive break below 24,900 could trigger a deeper correction toward 24,788 and even 24,650 if selling accelerates.
-
However, this remains less likely unless macro data turns significantly negative.
Neutral View
-
Short-term consolidation between 25,000 and 25,150 is likely as the market digests recent gains.
-
Traders should watch for RSI breakout or breakdown to determine the next impulse direction.
Conclusion : A Controlled Pause Before the Next Push
In summary, today’s Nasdaq 100 session represents a healthy pullback within an ongoing uptrend. The market remains fundamentally strong, supported by resilient tech demand and solid earnings momentum from AI-related firms.
The price structure, combined with momentum indicators and sectoral rotation, suggests that the current retracement could serve as a launchpad for another bullish leg once short-term overbought conditions normalize.
In simpler terms … the trend remains your friend. Unless price breaks decisively below 24,788, buyers remain in control.