The EURUSD showed strong recovery momentum Trading today after several days of weakness, rising from the 1.1550 support area to retest the 1.1620 zone. The rebound came as the US Dollar weakened slightly following mixed economic data and a decline in Treasury yields.
However, the pair now faces a key technical challenge: a descending trendline that has capped upside moves since late September. This level will determine whether EURUSD can extend its bullish correction into a full-scale reversal or if sellers will regain control.
Trading Plan and Strategy :
Aggressive Scenario
Aggressive traders may look for early buy entries near 1.1600 to 1.1610 with stop loss below 1.1560. The immediate target is 1.1680 and 1.1728. If price breaks above the orange descending trendline convincingly, the bullish momentum could accelerate quickly.
Conservative Scenario
Conservative traders should wait for a confirmed breakout and retest above 1.1680. A successful retest forming a higher low near 1.1660 would provide confirmation of bullish continuation. In this case, long positions can target 1.1728 first and 1.1800 next.
Intraday Outlook
Intraday bias remains neutral-to-bullish above 1.1600. As long as price trades above the 50 EMA on the 1H chart, buyers are likely to control short-term direction. A drop below 1.1580 would neutralize this bias and open the door for another test of 1.1540 support.
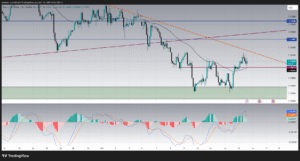
1H Chart Analysis : Short-Term Recovery Under Watch
The 1H chart shows how EURUSD managed to rebound from the green demand zone between 1.1540 and 1.1560. This zone has acted as strong support since early October, attracting buying interest each time price approached it.
After the rebound, the pair climbed above the short-term 50-period moving average and is now consolidating near 1.1620. The Stochastic Oscillator shows that momentum cooled down after reaching the overbought zone. Currently, both lines are around the 20-30 region, which indicates a short-term correction phase within the new uptrend.
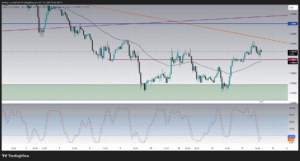
The structure is clean: higher lows and higher highs have begun to form, suggesting that the short-term bearish trend may be shifting into a bullish reversal. However, the orange descending trendline near 1.1635 remains an obstacle. If buyers manage to break and close above this line, the pair could move rapidly toward 1.1680.
Key levels on the 1H chart:
-
Support: 1.1600 and 1.1560
-
Resistance: 1.1635 and 1.1680
-
Short-term bias: Bullish while above 1.1600
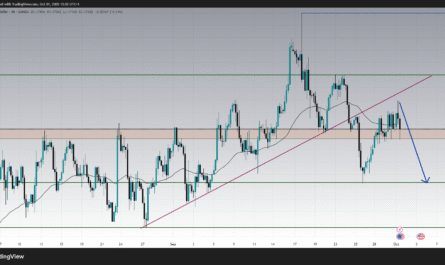
2H Chart Analysis : Momentum Rebuilding
On the 2H chart, EURUSD shows a more mature recovery setup. The MACD histogram has turned positive after several sessions of red bars, showing that bullish momentum is returning. Both signal lines are above the zero axis, which supports the idea that the market has shifted from a deep correction into a possible trend reversal.
The price is currently testing the intersection of the 50 EMA and the descending trendline from the previous highs. This confluence often acts as a decision zone. If the pair manages to hold above 1.1600 and break through the trendline, it will confirm that buyers are regaining medium-term control.
Below 1.1600, sellers might attempt to push price back to the demand area at 1.1550, but this would likely be a temporary pullback rather than a complete reversal.
Technically, as long as price stays above 1.1560, the bullish recovery scenario remains valid. Traders should also note that the last impulsive candle formed a strong bullish engulfing pattern, which often marks the beginning of a trend shift.
Key levels on the 2H chart:
-
Major support: 1.1560
-
Pivot: 1.1600
-
Resistance zone: 1.1680 to 1.1728
-
Bias: Bullish continuation above 1.1600
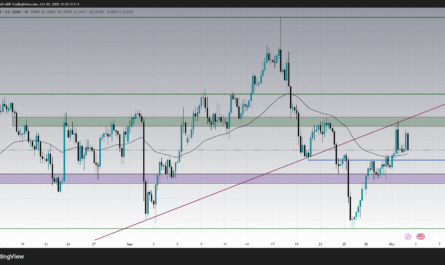
4H Chart Analysis : Testing the Downtrend Line
The 4H chart provides the broader technical picture. EURUSD has been in a corrective phase since late September, forming a descending channel with lower highs and lower lows. The orange trendline connecting those highs is now being tested, which makes the current level highly significant.
The RSI indicator on this timeframe is showing an interesting signal. It has broken its own internal descending trendline and is now moving upward above 50, suggesting momentum strength. As long as RSI stays above 45, bulls maintain control.
Additionally, the purple ascending support line that originates from early September continues to hold, confirming that the larger bullish structure (from the 1.0500 base) is still intact.
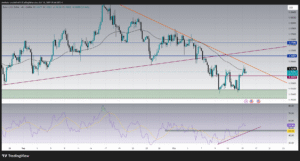
The area between 1.1680 and 1.1728 is the next major resistance block. A breakout above this zone would mark a structural shift on the 4H chart and potentially confirm a long-term bullish reversal. Until then, traders should consider this region as a profit-taking zone.
Key 4H technical zones:
-
Dynamic resistance: 1.1630-1.1680 (orange trendline)
-
Horizontal resistance: 1.1728
-
Key support: 1.1560-1.1540
-
RSI structure: Rising with positive divergence
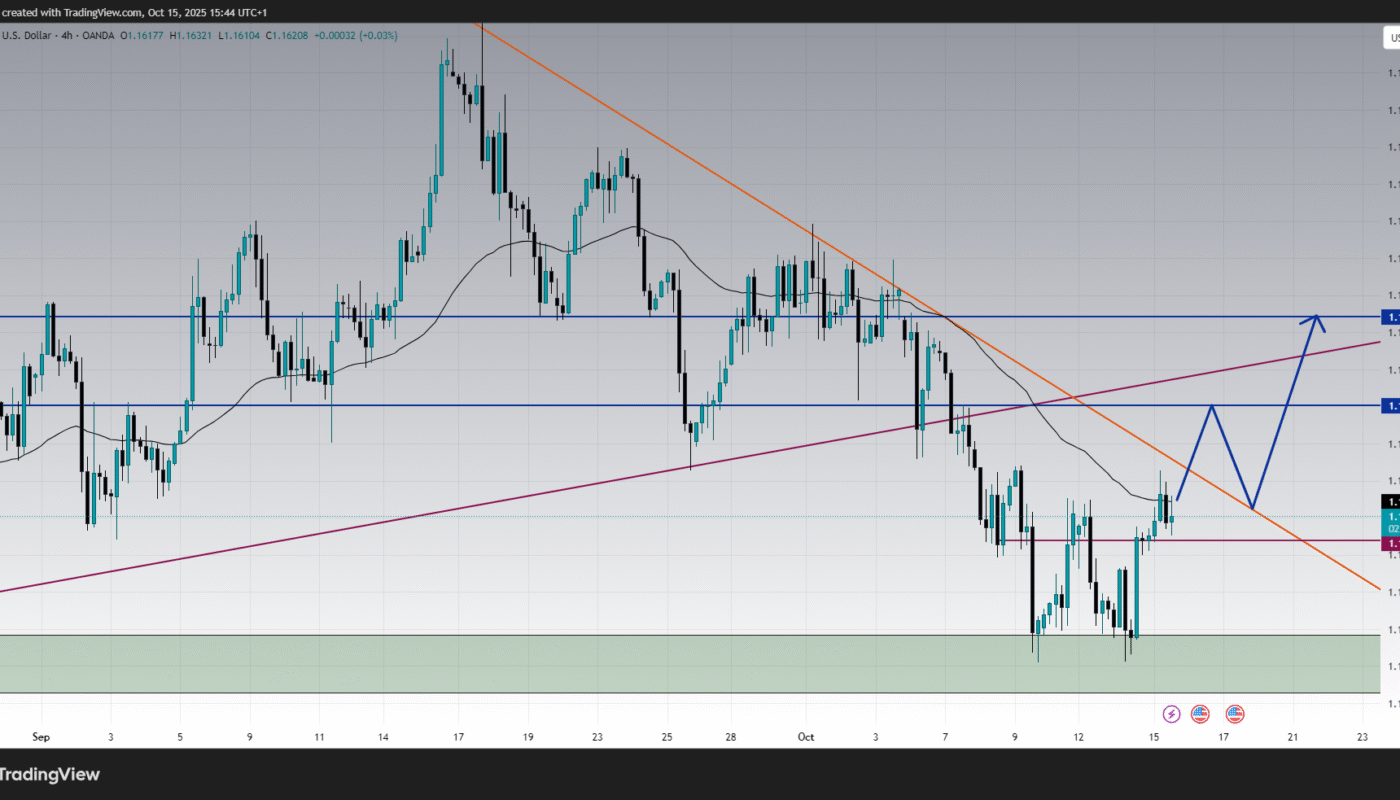
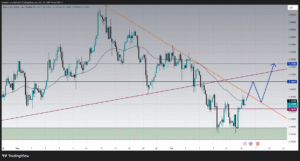
Projection Chart : Breakout Scenario in Progress
The projection chart outlines the expected market path based on current structure and market sentiment. After multiple failed attempts to break below the 1.1540 demand zone, buyers are gradually gaining control.
The projection anticipates that EURUSD will first challenge the descending trendline near 1.1630. If it breaks above this level, a short-term pullback toward 1.1660 could occur before the next impulse wave toward 1.1680 and 1.1728.
This pattern aligns with a potential inverse head and shoulders formation, where the left shoulder and head are already visible, and the right shoulder may form near 1.1600-1.1610 before the breakout. If confirmed, the measured target would point toward the 1.1800 zone in the coming sessions.
Fundamental and Economic Context :
The fundamental landscape continues to influence EURUSD dynamics. Recent US inflation data came out softer than expected, leading markets to price in a higher probability of a rate cut from the Federal Reserve in early 2026. At the same time, several European Central Bank officials have signaled cautious optimism regarding inflation returning to target, which provided modest support for the Euro. Check Economic Calendar
However, the Eurozone economy remains fragile, with growth data showing stagnation in industrial activity. This limits the potential for an extended rally unless the US Dollar weakens more broadly. Traders are also paying attention to upcoming macroeconomic releases such as US retail sales, Eurozone CPI revisions, and Federal Reserve speeches that could trigger volatility.
From a risk perspective, global investors are balancing between risk appetite and yield expectations. If risk sentiment continues to improve in equity markets, EURUSD may benefit as capital flows out of safe-haven assets.
Comprehensive Technical Summary :
-
Overall trend: Bearish bias fading, potential bullish reversal
-
Momentum: Turning positive on 2H and 4H timeframes
-
Structure: Higher lows forming from 1.1540 base
-
RSI: Climbing above 50, showing healthy momentum
-
MACD: Bullish crossover on 2H, confirming momentum shift
-
Critical zones:
-
Support: 1.1560 and 1.1540
-
Resistance: 1.1680 and 1.1728
-
Pivot level: 1.1600
-
-
Price action bias: Accumulation phase before breakout
Outlook and Forecast :
If EURUSD successfully breaks and closes above the orange descending trendline and holds above 1.1680, the pair could begin a medium-term bullish phase targeting 1.1728 and 1.1800.
If sellers defend this zone strongly, we might see a short retracement back toward 1.1560 before another attempt higher. Check Last Analysis
Traders should closely monitor how price reacts to the 1.1630-1.1680 area in the next sessions. The reaction here will determine whether the correction transforms into a sustained uptrend or remains part of the broader consolidation range.
Conclusion : Euro Building a Foundation for a Reversal
In conclusion, EURUSD is showing encouraging signs of recovery after weeks of downside pressure. The structure across all timeframes indicates that the pair is preparing for a potential bullish breakout, provided buyers manage to push price above the descending resistance.
The key to watch is the reaction around 1.1600-1.1630 and then 1.1680. Holding above these zones keeps the bullish scenario valid. A break below 1.1540 would cancel the outlook and return control to sellers.
Overall, this setup offers a balanced opportunity for both aggressive and conservative traders depending on their risk profile. The market is transitioning from bearish to neutral and possibly to bullish as momentum rebuilds. Traders who follow the structure patiently and wait for confirmation may capture the next impulsive wave in the Euro.