Bitcoin (BTCUSD) is trading around $118,900, holding just below the highly anticipated $120,000 psychological resistance. The cryptocurrency has staged a sharp rebound from last week’s consolidation near $110,000, fueled by renewed risk appetite, institutional inflows, and a weaker U.S. dollar.
The uptrend remains firmly in place, supported by price action above the 50-period simple moving average (SMA) and a clear ascending trendline across multiple timeframes. Market momentum is strong, but indicators suggest short-term overbought conditions, raising the possibility of a consolidation before a decisive breakout.
In this analysis, we review Bitcoin’s short-term and medium-term technical outlook, highlight the key levels to watch, and assess the economic drivers shaping BTC’s next move.
Short-Term Technical View : 1H and 2H Charts
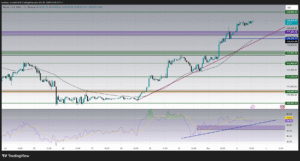
On the 1-hour chart, Bitcoin has extended its rally from $109,000 support, surging more than 8% within a few sessions. Price is trending comfortably above the $117,600 breakout level, which now acts as immediate support. As long as BTC holds above this zone, the bullish momentum is likely to continue.
-
Immediate Support: $117,600 – previous resistance, now turned into support.
-
Secondary Support: $116,800 – aligned with the trendline and short-term moving average.
Momentum indicators, however, are signaling caution. The Relative Strength Index (RSI) hovers near 70, reflecting overbought conditions. A pullback toward $117,600 or even $116,800 would be healthy before a renewed attempt at $120,000.
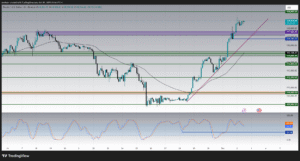
On the 2-hour chart, the rally is even clearer. BTC broke through multiple resistance levels between $113,800 and $115,000, confirming a strong bullish structure. The Stochastic Oscillator shows signs of cooling from overbought zones, hinting at consolidation. Still, the broader setup points toward buyers maintaining control unless $115,000 breaks decisively.
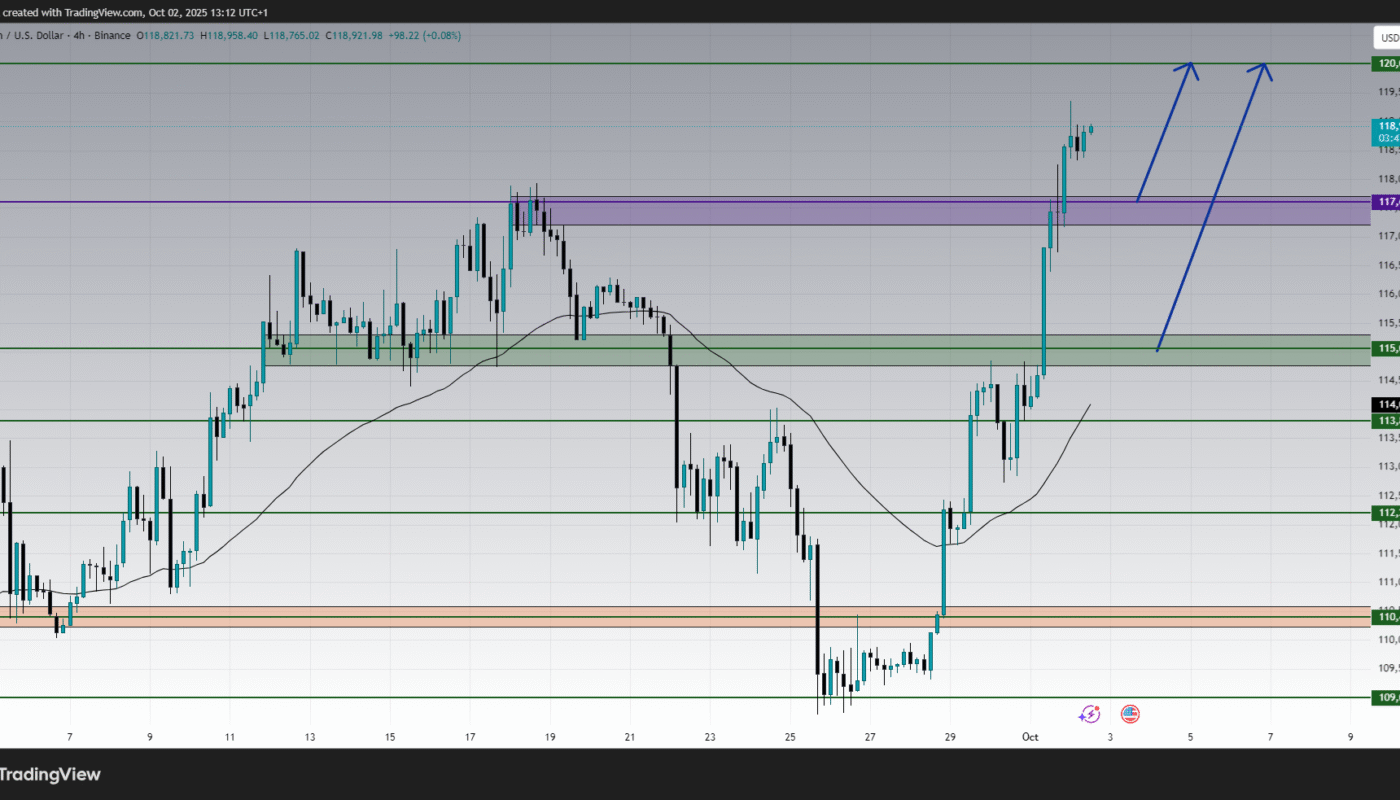
Medium-Term Technical View : 4H Chart
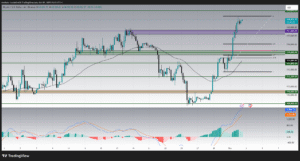
The 4-hour timeframe underscores the strength of the current bullish trend. Since bouncing from $109,000, Bitcoin has formed a textbook sequence of higher highs and higher lows. The breakout above $117,600 is particularly significant, as it clears a level that capped gains during September.
-
Major Resistance: $120,000 – a psychological and technical barrier.
-
Extended Resistance: $122,500 – next bullish target if $120,000 is cleared.
-
Medium-Term Support: $115,000 – key pivot zone to watch during pullbacks.
The MACD histogram remains positive, showing bullish momentum, though the slope is beginning to flatten. This suggests that while the uptrend is intact, Bitcoin may face consolidation or mild retracement before another surge higher.
Key Levels to Watch :
-
Immediate Resistance: $120,000 – psychological and technical barrier.
-
Major Resistance: $122,500 – extended bullish target.
-
Immediate Support: $117,600 – short-term breakout level.
-
Secondary Support: $116,800 – aligned with moving averages.
-
Major Support: $115,000 – must hold to preserve the bullish outlook.
Economic and Fundamental Drivers :
Bitcoin’s bullish momentum is not purely technical; fundamentals are also providing strong support:
-
U.S. Dollar Weakness – The dollar index (DXY) has shown signs of softening as markets anticipate the Federal Reserve could maintain a dovish stance. A weaker dollar typically supports risk assets like Bitcoin.
-
Institutional Demand – Several large funds have increased exposure to digital assets, with inflows into Bitcoin ETFs rising sharply over the past two weeks. This has reinforced BTC’s role as a portfolio hedge.
-
Macroeconomic Environment – Global uncertainty, mixed economic data, and inflation risks continue to fuel demand for Bitcoin as a hedge against traditional market volatility.
-
Halving Cycle Support – With the next Bitcoin halving less than a year away, investor sentiment is becoming increasingly bullish, historically a key driver of pre-halving rallies.
These macroeconomic and fundamental drivers align with the bullish technical picture, reinforcing the probability of Bitcoin attempting a sustained break above $120,000.
Scenario Outlook :
Bullish Scenario: If Bitcoin closes firmly above $120,000, it could trigger fresh buying momentum, targeting $122,500 in the short term. A continuation beyond that could even set the stage for $125,000–$128,000 in the medium term, especially if institutional inflows remain strong.
Bearish Scenario: Failure to clear $120,000 convincingly may lead to consolidation or a retracement. In such a case, a pullback toward $117,600 or $115,000 would be likely. Only a decisive break below $115,000 would shift momentum back to sellers, exposing Bitcoin to deeper corrections toward $113,800 and possibly $112,200.
Conclusion :
Bitcoin (BTCUSD) is trading just shy of $120,000, with bullish momentum intact across short and medium-term charts. While overbought signals may trigger temporary consolidation, the broader uptrend remains strong as long as BTC holds above $115,000.
Key takeaway: A sustained breakout above $120,000 could open the door toward $122,500 and higher, while dips toward $117,600–$115,000 are likely to attract buyers.
With technicals aligned and fundamentals supportive, Bitcoin’s path of least resistance remains upward. Traders should monitor $120,000 closely, as it will likely define the next chapter in BTC’s ongoing bull run.