Gold (XAUUSD) has seen a significant pullback Trading today after an impressive bullish wave that pushed prices from 4000 toward 4144. The metal has been one of the strongest performers in recent weeks, supported by falling Treasury yields, global geopolitical uncertainty, and speculation that the Federal Reserve will start easing monetary policy in the coming quarters.
However, as the momentum stretched higher without deep retracements, short-term traders began to take profits, leading to a healthy correction visible across all timeframes. The current movement reflects a normal market phase where overbought conditions trigger consolidation before the next impulsive leg.
At the time of writing, Gold is hovering around 4106. The intraday structure shows that the metal is temporarily losing strength, but the medium-term outlook remains positive as long as price holds above 4000.
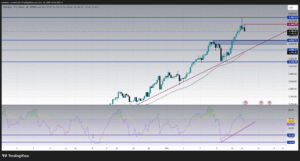
1H Chart Analysis : Short-Term Pullback and Overbought Reaction
The 1H chart clearly displays the latest exhaustion move. After hitting 4144 resistance, XAUUSD failed to sustain momentum and dropped to the 4100 zone. The most important detail here is the Stochastic Oscillator, which fell aggressively from overbought levels above 80 to the 10 region, confirming that buyers are taking a pause and that a local correction is underway.
In addition, the short-term moving average (the 50 EMA) is slightly flattening, suggesting that momentum is cooling down. However, the general structure of higher highs and higher lows remains intact. Show last analysis
Technically, we have three key zones on this chart:
-
4144 Resistance: This is the most recent high where sellers reacted strongly. A clean break and 1H candle close above it will open the door for a continuation toward 4180.
-
4085 Support: This level has acted as a reaction zone several times and now aligns with the 50 EMA, giving it technical significance.
-
4058 Key Demand Area: Below this, a deeper retracement could occur, but it still aligns with the higher structure.
If the price stabilizes above 4085 and buyers regain strength, we could see another impulsive leg toward 4140–4180. But if 4085 fails, traders should watch 4050 as a deeper re-entry zone.
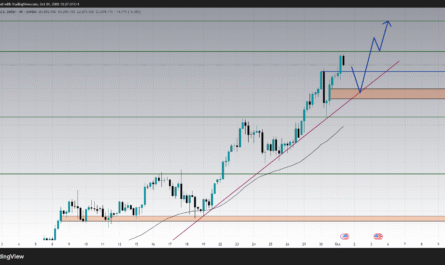
2H Chart Analysis : Momentum Cooling but Structure Intact
On the 2H chart, the MACD and moving averages confirm that the market is entering a corrective phase, not a full reversal. The MACD histogram turned red for the first time after several bullish sessions, showing that bullish momentum is temporarily weakening. Yet, the signal lines are still above the zero line, confirming that the broader structure remains bullish.
The most important visual clue on this chart is the ascending trendline connecting the lows around 3930 and 4000. This dynamic support continues to guide the uptrend and remains unbroken. As long as price stays above that line, the uptrend remains valid.
Additionally, the previous resistance between 4058 and 4008 now acts as a support block. Historically, this area was where the last consolidation before the breakout occurred, which means it has strong institutional demand.
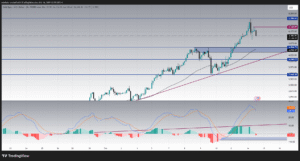
The 2H chart gives the impression of a “breathing market” after a strong impulse, the market is catching its breath before resuming the next leg. The ideal setup would be a retest near 4058 with a bullish confirmation candle, signaling a continuation of the uptrend toward 4144 and then 4180.
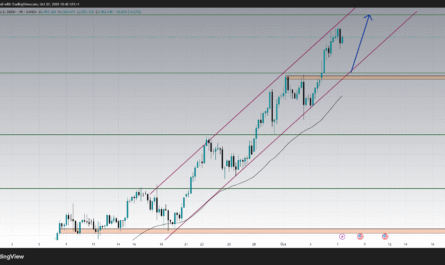
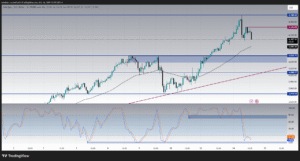
4H Chart Analysis : Trendline Respect and RSI Structure
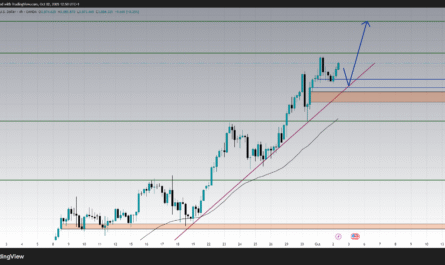
The 4H chart provides a clearer perspective of the entire bullish wave. From late September until mid-October, Gold created a clean series of higher highs and higher lows, respecting an ascending trendline that acts as the main support of the trend.
The RSI on this timeframe has also been very consistent. It recently touched the 70 zone and then started to correct back toward 60, which means momentum is normalizing after overbought conditions. A healthy RSI correction like this often precedes a continuation, not a reversal.
The trendline from the 3900 zone continues to act as a strong backbone for the uptrend. Each time price touches this line, buyers step in aggressively. For now, the nearest intersection of this trendline lies around 4020–4040, which aligns perfectly with the horizontal support on lower timeframes.
In addition, the 50 EMA on the 4H chart lies close to 4050, creating a confluence of supports horizontal, dynamic, and psychological. This alignment increases the probability that Gold will find demand around that area and resume its bullish trajectory.
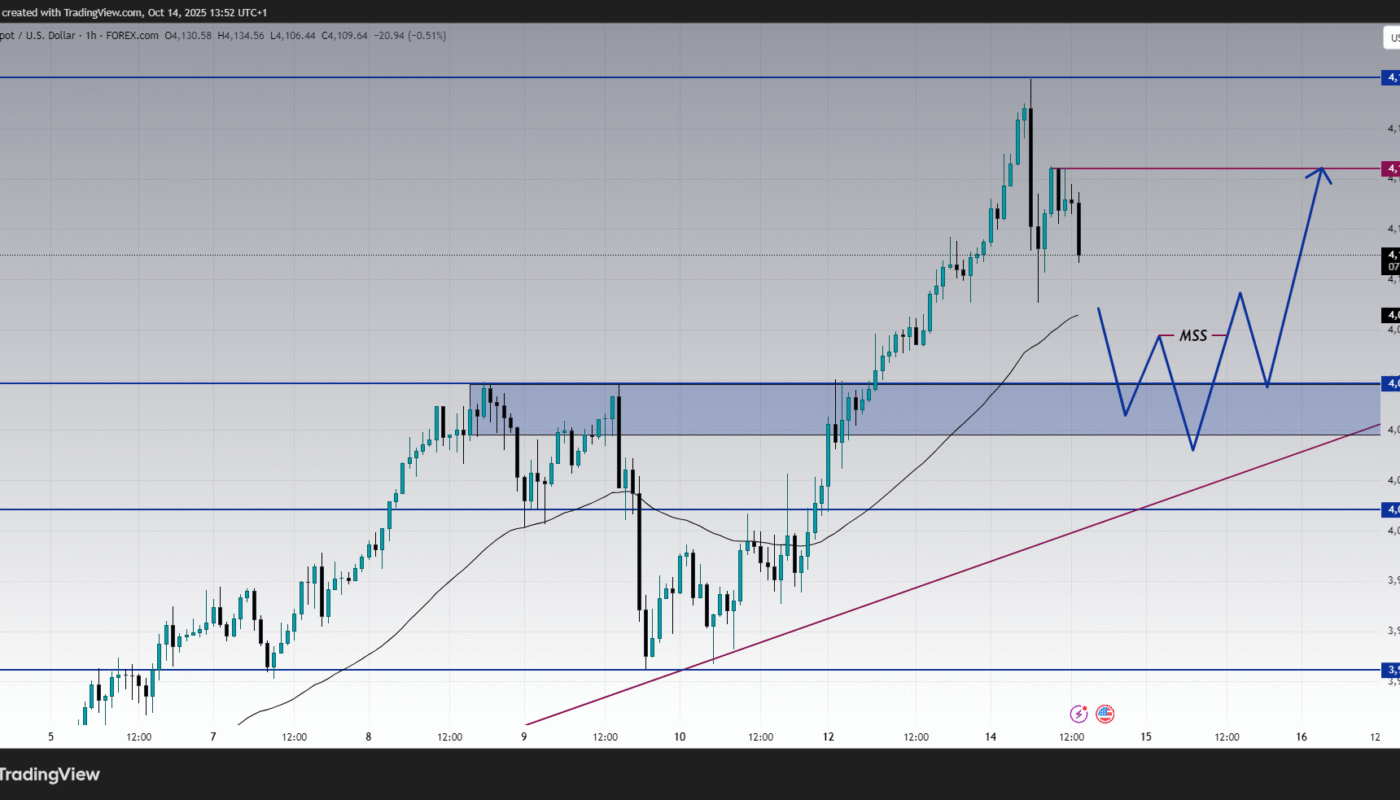
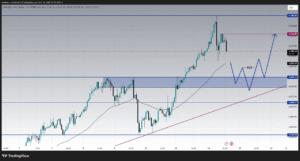
Projection Chart : Expected Scenarios for the Next Move
The projection chart shows a possible market structure shift (MSS) forming between 4050 and 4080. This pattern is common after strong rallies when the market needs to retest a previous structure before continuing the trend.
The illustrated projection suggests that Gold might form a small double bottom or a W-shaped structure inside the 4050–4080 zone before heading higher again. The logic is simple: after a strong push, smart money often drives price down to collect liquidity below recent lows and trigger stop losses of impatient buyers before launching the next bullish wave.
Once this accumulation phase ends, the next upward impulse could target 4144 again and possibly extend to 4180–4200, which represents the next institutional resistance area.
Understanding the Economic Context :
From a fundamental point of view, Gold continues to benefit from a combination of macroeconomic and geopolitical factors. The global economy is showing mixed signals. US data in recent days revealed slower inflation but still strong service demand, leaving traders uncertain about the timing of rate cuts … Economic Calender
At the same time, geopolitical risks and the ongoing volatility in energy prices maintain the safe-haven demand for Gold. The recent retreat in the US Dollar Index also provided additional support for XAUUSD buyers. However, today’s mild rebound in the Dollar caused a short-term correction in Gold, which is visible on the 1H chart.
Investors now focus on upcoming speeches from the Federal Reserve and the next inflation expectations data. Any sign of dovishness or slowdown in economic activity will support Gold, while any hawkish tone could extend the short-term correction.
Detailed Technical Summary :
-
Trend Direction: Uptrend on 4H and daily, correction on 1H and 2H
-
Momentum: Cooling but still positive on higher timeframes
-
RSI (4H): 65, showing controlled bullish momentum
-
Stochastic (1H): Oversold, ready for potential reversal
-
MACD (2H): Weakening but still above zero line
-
50 EMA Support Zones: 4050–4080 on intraday charts
-
Major Demand Zone: 4000–4050
-
Resistance Zones: 4144 and 4180
All these alignments suggest a textbook bullish continuation setup, where a short retracement allows large buyers to re-enter before pushing the market higher.
Trading Plan and Strategy :
Traders should monitor the area between 4050 and 4080 closely. This zone is the most strategic for re-entry in the direction of the main trend. Look for bullish rejection candles or divergence on lower timeframes (like 15M–30M) for confirmation.
-
Aggressive Entry: Around 4060–4070 with stop loss below 4000 and target 4144–4180.
-
Conservative Entry: Wait for confirmation above 4100 after retest and enter once the market reclaims momentum.
-
Intraday Pivot: 4090 remains the key level to monitor for momentum changes.
Risk management should remain strict. Even though the trend is bullish, volatility can spike during US session hours or news releases. Avoid trading emotionally and keep position sizes consistent with your risk tolerance.
Forecast and Outlook :
If Gold holds above 4050 and forms bullish confirmation signals, the probability of continuation toward 4144 and 4180 is very high. The 4180 zone could act as a strong resistance again before any major breakout. If that level breaks with strong momentum, the next objective for buyers will be around 4220–4250.
On the other hand, if price breaks below 4008, the uptrend structure will weaken, and the market might start a deeper correction toward 3945 before buyers attempt to recover control again.
Overall, the dominant bias remains bullish. The current correction is technical and healthy. Long-term traders should stay patient and prepare to take advantage of the next upward impulse once price confirms support around 4050.
Conclusion : Healthy Correction Before Potential New Rally
Gold’s correction today is part of a natural market cycle. After a powerful upward move, the market needs to retrace and collect liquidity before extending higher. The structure on 2H and 4H charts remains very solid, supported by a strong ascending trendline and clear bullish momentum.
As long as XAUUSD stays above 4000, the bullish trend is not in danger. Traders should focus on confirmation around the 4050 zone, which could become the next high-probability buying area. The next bullish wave could easily bring Gold back toward 4144 and 4180.
This analysis suggests that Gold remains one of the most technically attractive assets for swing traders in the current macroeconomic environment. The combination of technical structure, risk sentiment, and global uncertainty keeps the outlook constructive for the metal in the coming days.