Bitcoin (BTCUSD) remains steady Trading today around $123,000, showing resilience after a sharp pullback earlier this week. Despite moderate volatility, the world’s largest cryptocurrency continues to hold above the key support area at $120,600–$121,000, which has repeatedly acted as a launch zone for bullish rebounds since the beginning of October.
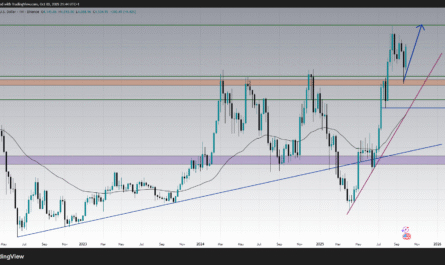
After an explosive rally that pushed BTC from $114,000 to $126,000 in less than two weeks, the market has entered a short-term consolidation phase. This healthy pause comes as traders await new catalysts, such as U.S. inflation data and potential ETF fund inflows.
In this detailed analysis, we’ll break down what happened in today’s Bitcoin session, study the attached 1H, 2H, and 4H charts, and present a data-driven forecast for the next move, supported by both technical and macro factors.
Daily Overview : What Happened in Bitcoin Today
Today’s price action was a story of defense and stabilization.
Bitcoin opened near $122,000, traded lower briefly toward $121,600, and then quickly recovered above the $122,800 zone as bulls defended the rising trendline support visible across all intraday timeframes.
The buying momentum intensified after the U.S. market open, when risk sentiment improved across global assets. NASDAQ futures stabilized, the dollar weakened slightly, and crypto assets mirrored the broader rebound. BTC/USD reached an intraday high of $123,200 before consolidating near $123,000 by afternoon European hours.
This performance highlights a key shift: Bitcoin is no longer reacting with high volatility to intraday sell-offs. Instead, buyers are using every dip near $121,000–$122,000 to reload positions. This behavior confirms that institutional demand remains active around these zones.
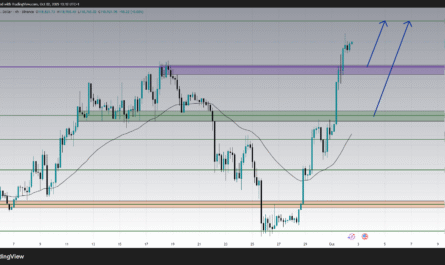
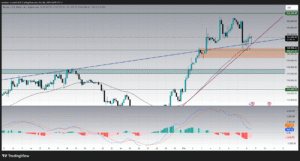
1-Hour Chart Analysis : Short-Term Trend and Momentum
The 1-hour chart shows a clean ascending trendline extending from early October, connecting higher lows from $117,000 up to the current support base near $121,000.
After last week’s rejection near $126,200, BTC corrected downward, but the structure remained intact. Today, price rebounded exactly from the blue ascending line and regained the 50-hour moving average … a bullish sign that suggests momentum is turning positive again.
Technical observations:
-
Price is holding above both trendline and the moving average (a dual support confluence).
-
The RSI has broken out from a descending resistance line and is now trending upward, confirming renewed buying strength.
-
As long as BTC stays above $122,000, short-term traders may look for retests toward $124,000–$125,000.
This recovery on the 1H timeframe implies that the market has completed its short-term correction and is potentially preparing for another impulsive move upward.
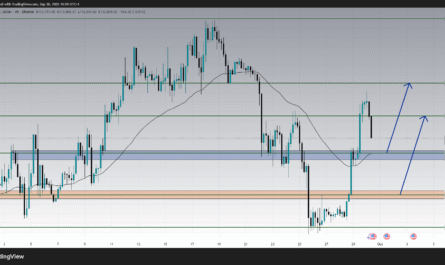
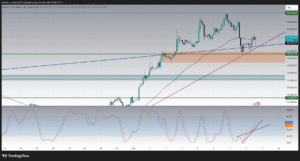
2-Hour Chart Analysis : Consolidation Before Expansion
The 2-hour timeframe offers a wider view of the recent consolidation range. Bitcoin continues to trade inside a shallow ascending channel, supported by the rising 50-period moving average and the trendline from early October.
The orange demand zone between $120,600 and $121,000 has acted as a perfect “buy zone” multiple times. Every dip into that region has produced strong rebounds, confirming it as institutional demand territory.
Meanwhile, the Stochastic oscillator is trending upward after rebounding from the oversold zone. The oscillator lines have crossed bullishly above 50, and a continuation of this move could trigger a retest of resistance at $124,000–$124,500.
In short, the 2H chart shows a market in controlled consolidation, with rising momentum and clear support boundaries.
If BTC sustains above $122,500 and breaks $123,500 decisively, it could open the door for the next leg toward $125,500–$126,000.
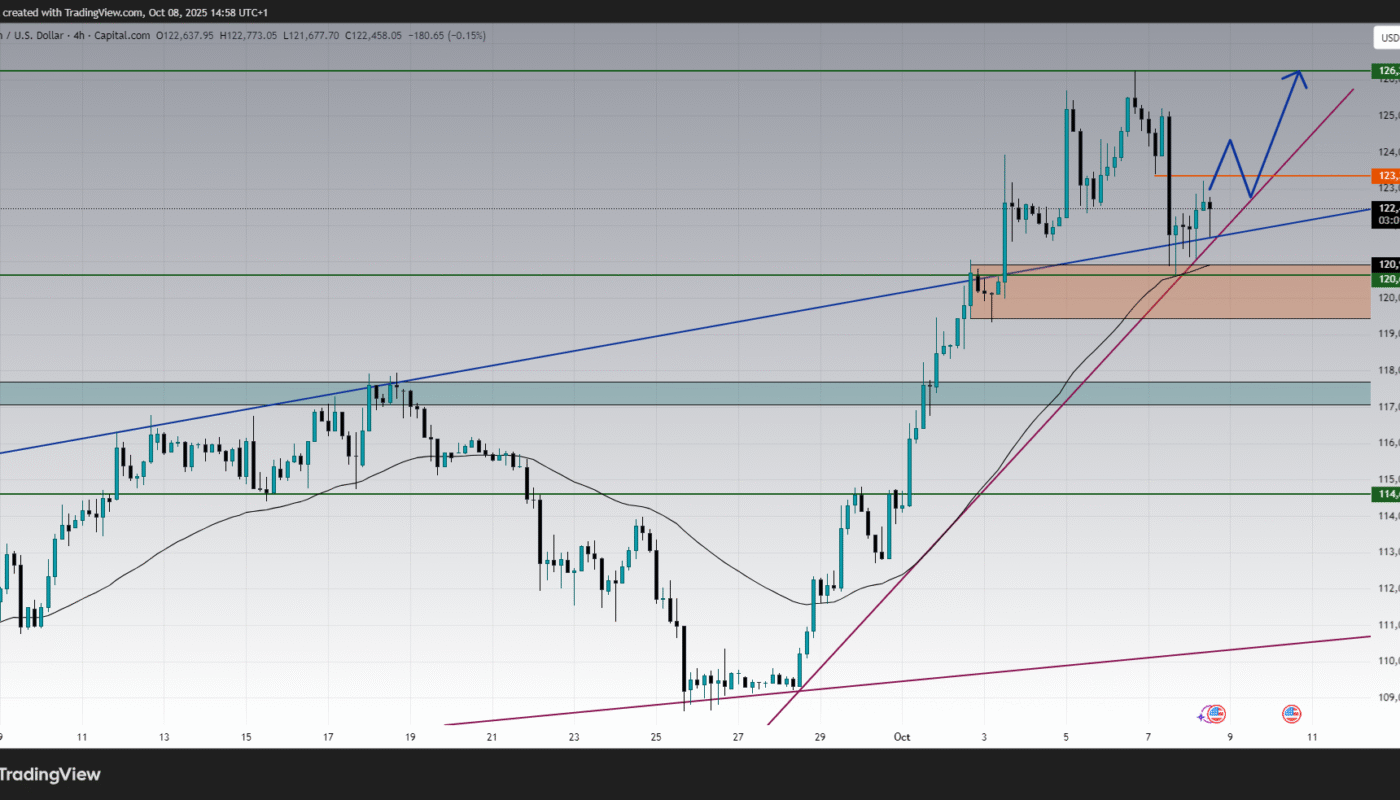
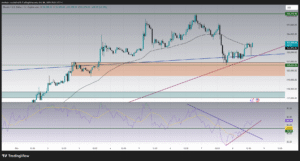
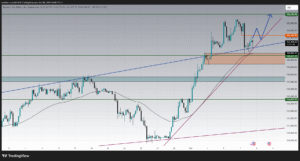
4-Hour Chart Analysis : The Broader Structure
The 4-hour chart confirms that Bitcoin’s mid-term trend remains decisively bullish.
After the breakout from the $117,000–$118,000 accumulation zone last week, BTC surged through multiple resistances, establishing new higher highs above $125,000 before retracing modestly.
The pullback toward $120,600 was technical and healthy, allowing indicators to reset. The MACD histogram, while still slightly negative, shows decreasing bearish momentum. The two MACD lines are now converging, signaling that a bullish crossover may occur soon — typically a strong buy confirmation on this timeframe.
Meanwhile, the trendline from late September, shown in red, continues to guide price action upward. As long as Bitcoin holds above this dynamic support and maintains candles above $122,000, the larger uptrend remains unbroken.
The key upside target remains $126,200, where previous highs and Fibonacci extensions align. A successful breakout above that level could extend the rally toward $128,500–$130,000.
Market Context : What’s Driving Bitcoin Now
Bitcoin’s recent movements are strongly influenced by macroeconomic and structural factors:
-
Cooling U.S. Dollar and Yields
The U.S. Dollar Index (DXY) has retreated slightly, and Treasury yields are stabilizing below recent highs. This environment supports risk-on assets, including cryptocurrencies. -
Spot Bitcoin ETF Flows
Institutional inflows into Bitcoin ETFs continue to grow steadily, providing fundamental demand. Even during price pullbacks, data shows accumulation by long-term holders. -
Broader Risk Sentiment
Equity markets, especially NASDAQ and tech stocks, are consolidating but not collapsing. This relative calm supports a low-correlation bullish environment for BTC. -
On-Chain Metrics
Exchange reserves remain near multi-year lows, while wallet activity from long-term investors is increasing. This suggests that supply pressure is declining — a structurally bullish signal.
These macro and fundamental drivers complement the bullish technical structure, explaining why dips are consistently met with aggressive buying interest.
Technical Outlook : Key Price Zones
-
Immediate Support: $122,000–$122,500 (trendline + moving average confluence)
-
Major Support: $120,600–$121,000 (strong demand area)
-
Immediate Resistance: $123,800–$124,000 (short-term cap)
-
Key Resistance: $125,500–$126,200 (recent swing high)
-
Bullish Target: $128,000+ if $126,200 breaks
-
Bearish Invalidations: Below $120,000, momentum would weaken and a deeper correction toward $117,500 could occur.
At this stage, Bitcoin is sitting comfortably above its primary support and is showing strong structure for continuation, as seen across all timeframes.
BTCUSD Forecast : What’s Next for Bitcoin
Bullish Scenario
If BTC continues to close hourly candles above $122,000, the current rebound could evolve into a full recovery wave.
A break above $123,800 would be the first bullish trigger, leading to $125,500, and then the major resistance at $126,200.
Above $126,200, technical momentum could accelerate sharply — targeting $128,000 and possibly $130,000, completing a measured move based on the width of the recent consolidation channel.
Momentum indicators (RSI and MACD) both support this bullish outlook, showing fresh upturns after resetting from overbought conditions.
Bearish Scenario
Alternatively, if Bitcoin fails to hold the $122,000 trendline, a short-term correction could unfold. In this case, price might retest $120,600, the upper border of the demand zone.
Only a decisive break below $120,000 would invalidate the bullish setup, potentially exposing a deeper correction toward $117,500–$118,000.
However, given the current market strength and improving momentum, this downside scenario remains secondary.
Market Sentiment and Trader Positioning :
Market sentiment across crypto exchanges remains cautiously optimistic. Derivatives data show that funding rates are stable and not excessively positive, suggesting that the market is not over-leveraged. This condition allows for sustainable upward movement without forcing liquidations.
Retail traders are still somewhat hesitant, while institutional buyers appear to be quietly accumulating … a typical hallmark of early-stage bullish continuation phases. Social sentiment analysis also indicates rising optimism, particularly as BTC consistently holds above $120,000.
Daily Summary and Key Takeaways :
Bitcoin’s current setup reflects a textbook bullish continuation structure.
After an initial correction from $126,200, price found solid support near $120,600 and has since formed a series of higher lows, confirming ongoing market confidence.
All three timeframes : 1H, 2H, and 4H … show synchronized upward momentum, supported by trendline alignment, moving-average confluence, and improving oscillator readings.
In summary:
-
Trend: Bullish, with healthy consolidation
-
Support: $120,600–$122,000
-
Resistance: $125,500–$126,200
-
Outlook: Continuation toward $126,000–$128,000 likely if support holds
-
Invalidation: Below $120,000 (temporary trend exhaustion)
As long as Bitcoin remains above its structural demand zone, the path of least resistance remains upward, with bulls eyeing another breakout attempt in the coming sessions.
Conclusion :
Bitcoin (BTCUSD) closed the day showing renewed strength, trading near $123,000 and respecting its rising trend structure. The market’s ability to recover from dips and maintain momentum above $122,000 reflects buyer dominance and strong institutional demand.
With technical indicators turning positive and global sentiment stabilizing, Bitcoin appears poised to extend its rally toward $126,000–$128,000 in the near term.
While minor pullbacks are always possible, the broader outlook remains decisively bullish as long as the $120,000 floor holds.
For traders and investors, this phase represents an opportunity to position strategically … buying dips into strength, not weakness. As the crypto market matures, today’s consolidation may well be the foundation for Bitcoin’s next major breakout.