The NASDAQ 100 (US100) ended Tuesday’s Trading session with mixed sentiment as investors balanced a wave of tech-sector volatility against cautious optimism ahead of key U.S. inflation data. Despite early weakness led by Tesla, Microsoft, and Google, the index managed to stabilize around 24,800, showing resilience at a key technical support zone.
Today’s trading reflected a healthy consolidation phase after several strong bullish sessions earlier in October. While some megacap stocks retreated, others like Netflix and ARM held firm, suggesting that capital rotation within the technology sector is still active rather than a full-scale correction.
In this article, we provide a comprehensive overview of what happened today on NASDAQ 100, analyze the attached technical charts (1H, 2H, 4H), examine the stock-market heatmaps, and discuss the forecast for the next move considering both price action and current macro context.
Daily Overview : What Happened in NASDAQ 100 Today
The U.S. session began with mild pressure as the tech sector opened lower, following weakness in semiconductor names and renewed selling in electric-vehicle stocks. Tesla (TSLA) plunged more than 4%, dragging sentiment in the consumer-durables segment, while Microsoft (MSFT) and Google (GOOGL) slipped modestly as traders booked profits after last week’s rally.
However, broad-market resilience remained visible, with Apple (AAPL) managing to hold near breakeven and Amazon (AMZN) posting small gains. The NASDAQ 100 index briefly dipped to a session low near 24,780 but quickly found buyers, rebounding toward 24,830–24,850 by the New York close.
This intraday recovery highlights the importance of the 24,750–24,800 support area, where both trendline confluence and previous demand zones converge. Overall, the index closed only –0.07% lower, showing that buyers are still defending the short-term trend.
Heatmap Insight : Sector Rotation and Market Behavior
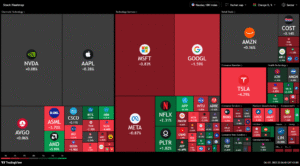
The two attached TradingView heatmaps show a notable contrast between early and late-session sentiment.
-
In the first heatmap, large-cap technology leaders remained mostly neutral:
-
NVIDIA (NVDA) –0.14%
-
Apple (AAPL) +0.03%
-
Microsoft (MSFT) +0.33%
-
Google (GOOGL) –0.10%
-
Tesla (TSLA) –3.30%
-
Broadcom (AVGO) +1.89%
This distribution shows that while chip stocks like AVGO and AMD attracted capital, EV and AI megacaps faced consolidation after heavy buying last week.
-

-
The second heatmap—captured later—shows deepening red across the board as MSFT –0.83%, GOOGL –1.59%, and TSLA –4.29% accelerated declines. Yet Netflix (+2.31%) and Palantir (+1.82%) bucked the trend, confirming selective strength among growth names.
These patterns indicate sector rotation rather than a broad market sell-off. Traders shifted temporarily from high-beta AI names toward diversified technology and communication-service stocks. The NASDAQ’s breadth remains stable, suggesting that today’s weakness may simply represent a technical pullback inside a broader bullish channel.
Technical Analysis : US100 Chart Breakdown
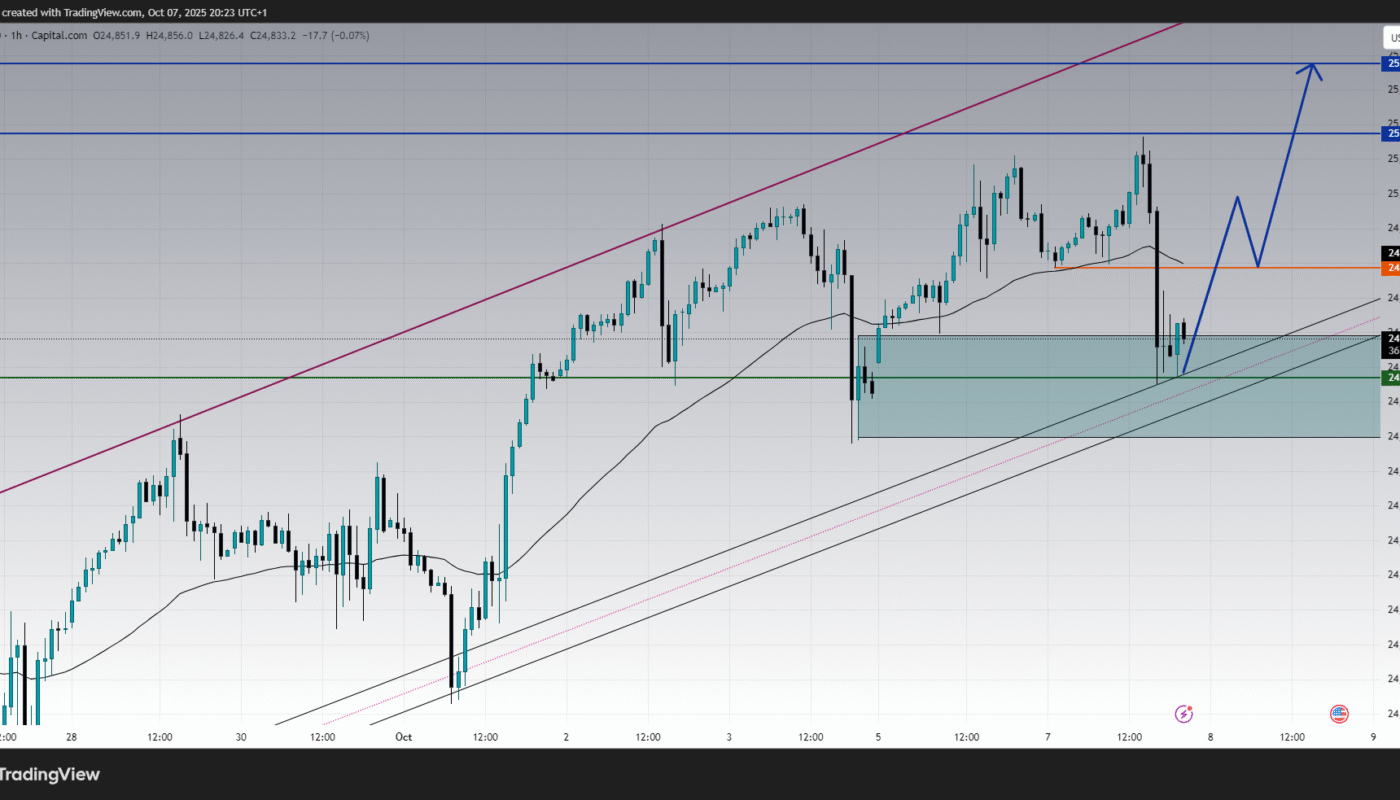
1-Hour Chart (Short-Term Reaction Zone)
The 1H chart highlights a clean retest of the 24,780–24,800 support area, a zone defined by both the ascending channel base and the 50-hour moving average. After a sharp sell-off from 25,050, price bounced precisely from this region, forming a rejection wick that shows buyers stepping back in.
-
Support: 24,780 – 24,800
-
Immediate Resistance: 24,915 – 24,920
-
Higher Target: 25,069 – 25,150
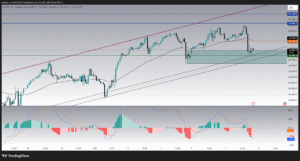
The MACD remains slightly bearish but histogram bars are flattening, suggesting momentum loss among sellers. A new bullish crossover in coming sessions could confirm the beginning of another upward leg.
The blue projection arrow in your chart outlines a potential double-impulse recovery scenario, where US100 could retest 24,920, consolidate, then push toward 25,100 and 25,150 if sentiment improves.
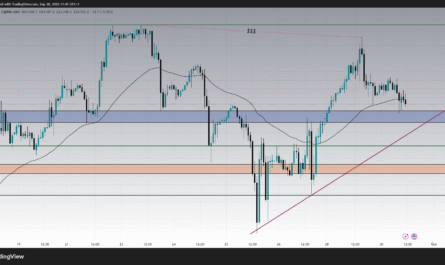
2-Hour Chart (Medium-Term Structure)
On the 2H chart, US100 remains within a parallel ascending channel that has guided the rally since mid-September. The index briefly dipped below the 20-period MA but quickly recovered, keeping the broader structure intact.
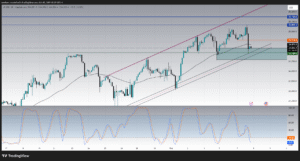
The Stochastic oscillator has entered the oversold zone (near 6–19), typically signaling exhaustion in downside momentum. Historically, similar readings during this uptrend preceded strong rebounds.
Holding above 24,780 is therefore key — it represents not just horizontal support but also the lower trendline of the mid-term bullish channel. If price remains above this level during tomorrow’s session, bulls could attempt a new drive toward the 25,000 handle.
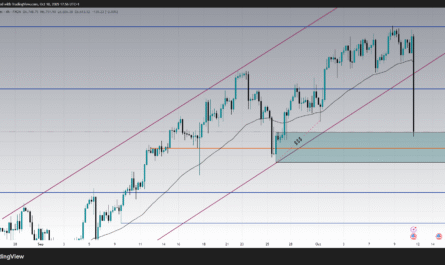
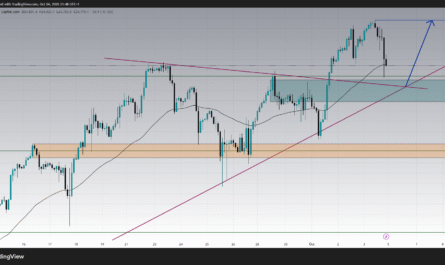
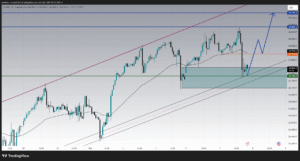
4-Hour Chart (Primary Trend Context)
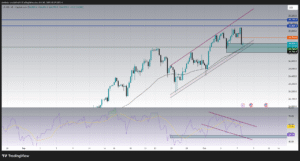
The 4H chart provides the most balanced view. The index has respected a well-defined uptrend from the September low near 23,950, gaining nearly 900 points in three weeks.
Currently, the structure shows a higher-high / higher-low pattern, with the recent correction appearing as a healthy retracement rather than a trend reversal.
-
Major Support: 24,780 – 24,760
-
Next Resistance Zone: 25,070 – 25,150
-
RSI: Now near 48, recovering from 40, forming a bullish divergence channel while price remains stable.
This divergence indicates that momentum loss on price dips is fading, often a precursor to a bullish resumption. If RSI breaks back above 60, it would validate renewed buying pressure targeting the upper channel boundary.
Market Interpretation : What the Data Means
Today’s mixed performance in the NASDAQ 100 can be interpreted as a pause within a bullish trend, driven by three main forces:
-
Profit-Taking in Megacaps:
After consecutive gains, investors locked profits in high-flyers like Tesla, Microsoft, and Google. This rebalancing phase tends to occur before major data releases. -
Rotation Into Selective Growth Stocks:
Money flowed into mid-tier performers like Netflix (+2.3%) and Palantir (+1.8%), indicating risk appetite hasn’t vanished—just redirected. -
Macro Anticipation:
Traders are awaiting U.S. inflation data and fresh Fed commentary. With yields easing slightly and the dollar stabilizing, equities are attempting to consolidate before a potential volatility spike later this week.
Key Technical Levels to Watch :
-
Resistance Zone 1: 24,915 – 24,950 → short-term pivot zone for buyers to reclaim momentum
-
Resistance Zone 2: 25,070 – 25,150 → major breakout target and potential take-profit region
-
Support 1: 24,780 – 24,760 → critical intraday demand
-
Support 2: 24,600 – 24,500 → secondary structural floor
Holding above 24,780 would maintain the bullish bias. A daily close below 24,700, however, might trigger a deeper correction toward 24,500–24,400.
NASDAQ 100 Forecast – What’s Next?
Bullish Scenario
If the US100 defends 24,780 and regains 24,920, momentum could shift back in favor of buyers.
The next breakout above 25,070 would likely confirm a continuation pattern, paving the way toward 25,150 and possibly 25,300 in the following sessions.
This outlook aligns with the overall market trend of buying dips while awaiting confirmation from macro catalysts such as CPI and earnings updates.
Bearish Scenario
A decisive break below 24,760 would invalidate the short-term bullish structure.
In that case, the index may correct toward 24,500, the next major horizontal support. However, given the strong trendline confluence and improving momentum indicators, this bearish outcome appears less probable unless accompanied by a sharp rise in Treasury yields or hawkish Fed rhetoric.
Market Sentiment and Investor Behavior :
Sentiment across major tech names remains cautiously optimistic. Retail traders are starting to hedge short-term moves, but institutional flow continues to favor large-cap accumulation on dips.
Derivatives data show call-option interest building around the 25,000 strike, implying expectations of recovery. Meanwhile, volatility indices remain subdued, reinforcing that the current pullback is seen more as a buying opportunity than a trend reversal.
Daily Summary :
Tuesday’s NASDAQ 100 session encapsulated the essence of consolidation inside a strong uptrend. Sellers tested the 24,780 zone, but buyers quickly absorbed pressure, confirming the importance of that level as a base of support.
The heatmap reveals that while a handful of megacaps experienced declines, several secondary tech names advanced—proving that the tech rally’s foundation remains broad rather than concentrated.
From both technical and fundamental standpoints, the overall market structure remains bullish, provided 24,780 continues to hold. Traders should keep an eye on the 24,915–25,150 zone for potential breakout confirmation.
In short:
🔸 Trend: Bullish consolidation
🔸 Key Support: 24,780
🔸 Key Resistance: 25,070 – 25,150
🔸 Bias: Buy-on-dip strategy favored
🔸 Outlook: Rebound toward 25,100 possible if macro data supports risk sentiment
Conclusion :
Today’s NASDAQ 100 price action reaffirmed the market’s strength even amid intraday volatility. The index is building a higher-low formation near 24,800, supported by both technical alignment and steady capital inflows.
As long as price remains above 24,780, the bullish outlook remains dominant, with the next logical target around 25,100–25,150. Traders should continue monitoring U.S. yields, inflation updates, and Fed commentary, as these catalysts could ignite the next directional move.
Ultimately, the NASDAQ 100 remains in an upward trajectory, characterized by healthy pullbacks, strong institutional support, and rotational flows across technology segments. Unless macro conditions shift drastically, the path of least resistance continues to point higher.