US100 index has been under pressure after failing to extend gains beyond the 24,783 resistance zone. Recent price action shows a pullback toward critical support levels, with traders now watching whether buyers can defend key demand areas or if further downside will follow. In this article, we will break down the latest technical signals, momentum indicators, and fundamental context to identify the best trading decisions for the coming sessions.
Short-Term Outlook : 30-Min and 1H Charts
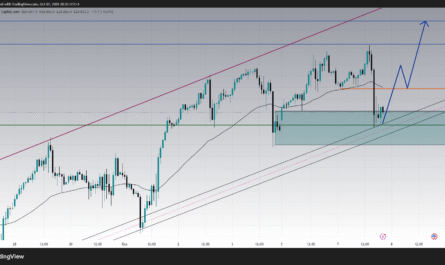
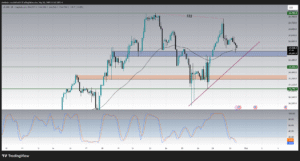
On the 30-minute chart, the US100 has retreated after testing highs around 24,720, now hovering near the 24,560 zone. The index is currently supported by the 24,520–24,480 range, highlighted by the blue demand area on the chart. A decisive break below this region could expose the next support at 24,436, while holding above it may provide buyers with another chance to challenge the upper resistance.
The MACD indicator is showing bearish momentum, with the histogram printing red bars and both signal lines pointing lower. This confirms that selling pressure remains in play, although a slowdown in bearish momentum suggests a potential stabilization near support.
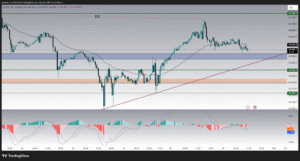
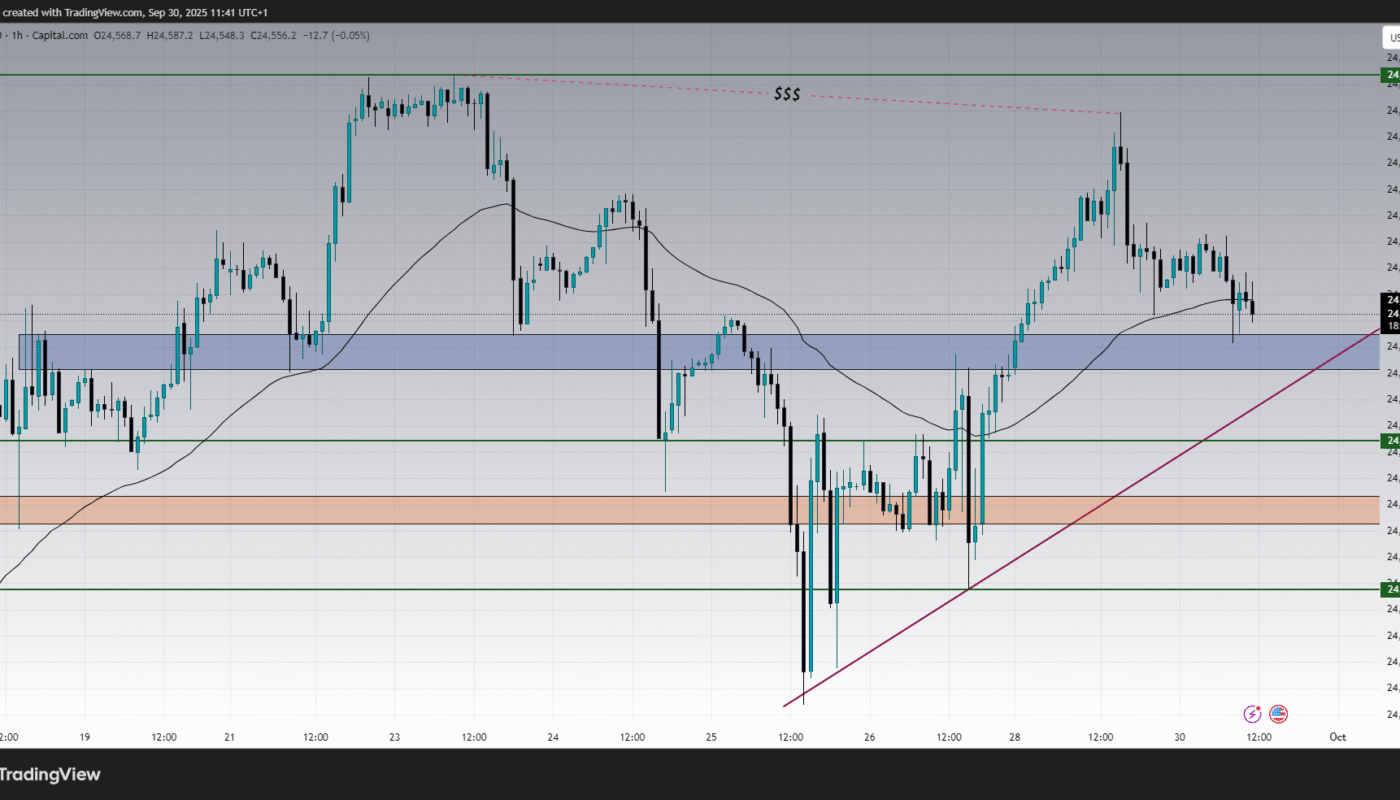
On the 1-hour chart, the 24,783 level continues to act as a major ceiling. The recent rejection highlights the importance of this barrier. Meanwhile, the moving average is currently aligning with short-term price action, further reinforcing the 24,500 area as a decision point for bulls and bears alike.
Medium-Term View : 2H and 4H Charts
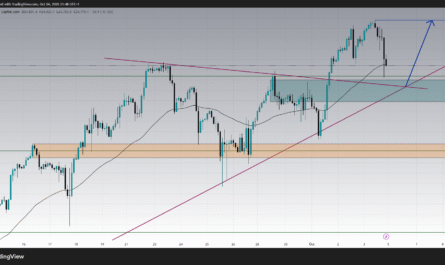
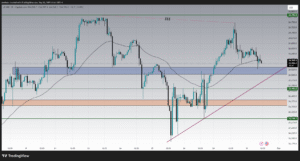
The 2-hour chart reveals that the US100’s uptrend from last week remains intact, as the market is still holding above the ascending trendline. However, repeated failures at 24,783 raise concerns about bullish exhaustion. If price loses the trendline, sellers could take control, driving the index toward 24,436 and possibly 24,294.
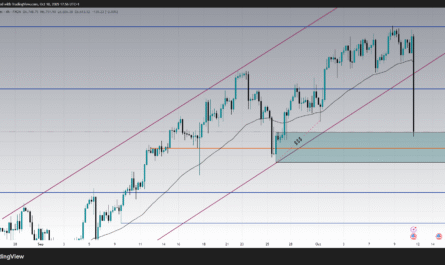
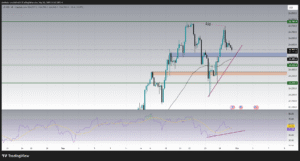
Looking at the 4-hour chart, momentum indicators paint a mixed picture. The RSI is hovering around 51, reflecting a neutral stance with neither side fully in control. Importantly, there is a slight bullish divergence forming – price made a lower high while RSI printed a higher low. This could be a signal of potential rebound if buyers defend support successfully.
Key Levels to Watch :
-
Immediate Resistance: 24,600 – A minor barrier before 24,783.
-
Major Resistance: 24,783 – The key ceiling where sellers are actively positioned.
-
Immediate Support: 24,520–24,480 – A pivotal zone; losing this could shift control to sellers.
-
Secondary Support: 24,436 – A key horizontal level tested multiple times.
-
Major Support: 24,294 – If broken, a deeper correction toward 24,150 may unfold.
Economic Context :
Beyond technical signals, Nasdaq’s movement is closely tied to broader economic dynamics:
-
U.S. Tech Earnings: Investors are cautious ahead of upcoming quarterly results, with major tech companies’ performance expected to influence the index.
-
Federal Reserve Outlook: Speculation around whether the Fed will maintain a pause on rate hikes continues to drive sentiment. Softer inflation data could benefit equities, while stronger data may trigger selling.
-
Global Risk Sentiment: Concerns around global growth and bond market volatility remain in play, leading to intermittent waves of risk-on and risk-off flows.
These macroeconomic drivers are critical to confirming whether technical supports hold or break.
Best Decision for Traders :
Given the current structure, the best decision in the short term is to wait for confirmation around the 24,520–24,480 support zone. If price holds above this area and momentum indicators turn upward, buyers may target a retest of 24,600 and then 24,783. A clean breakout above 24,783 would confirm renewed bullish momentum, with the potential to open the way toward 25,000.
On the other hand, if the index breaks below 24,480 with strong volume, it would be a bearish signal, exposing 24,436 and 24,294 as the next downside targets. In that case, traders may consider short setups with tight risk management.
Conclusion :
The Nasdaq 100 is at a critical crossroads. The market remains above its rising trendline, but repeated rejections near 24,783 highlight strong selling pressure. As long as US100 holds above 24,520, bulls have a chance to regain control. However, a break below this level would shift momentum in favor of bears, targeting 24,436 and beyond.
For now, traders should stay patient and watch the reaction at the 24,500 zone. The decision between a bounce or breakdown at this level will likely define the index’s direction for the coming sessions.