Bitcoin (BTCUSD) continues to capture the attention of traders as volatility returns to the crypto market … After a sharp rebound from the $109,000 area, the leading cryptocurrency surged above key resistance zones, testing levels near $114,500 before facing selling pressure. With traders closely monitoring short-term and mid-term charts, the battle between bulls and bears is heating up. In this analysis, we will review the most important support and resistance levels, momentum indicators, and possible scenarios for Bitcoin in the coming sessions.
Technical Outlook on the 1H and 2H Charts :
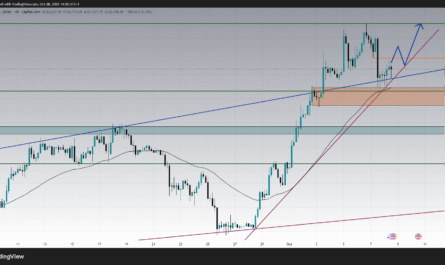
On the 1-hour chart, Bitcoin recently rallied from $110,400 support to the $114,000 zone, breaking above a key supply region around $112,200. This breakout triggered bullish momentum, but the move quickly stalled as sellers stepped in near $114,800, close to the resistance line at $115,225.
Currently, BTC is pulling back toward the $112,700–$113,000 region, which aligns with the moving average acting as dynamic support. If the price manages to stay above $112,200, bulls may attempt another push higher. However, a decisive break below this level could open the way for a retest of $111,800 and potentially $110,400.
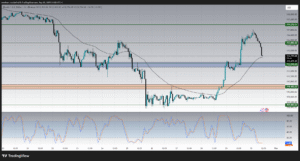
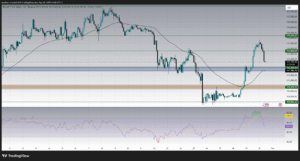
On the 2-hour timeframe, momentum indicators confirm this correction. The RSI recently climbed above 74, signaling overbought conditions before turning lower, suggesting that buyers are taking profits. A healthy pullback is often necessary to reset momentum before any sustained upward move.
4H Chart : Mid-Term Levels in Focus
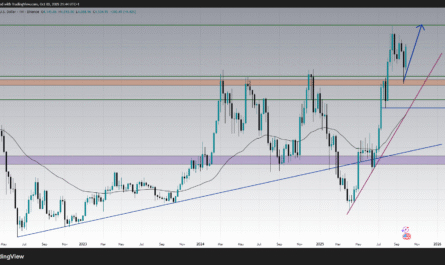
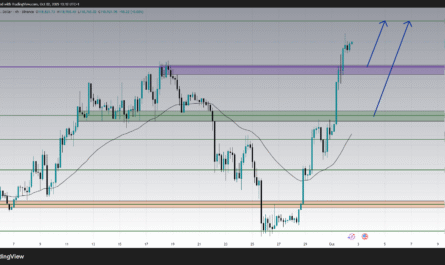
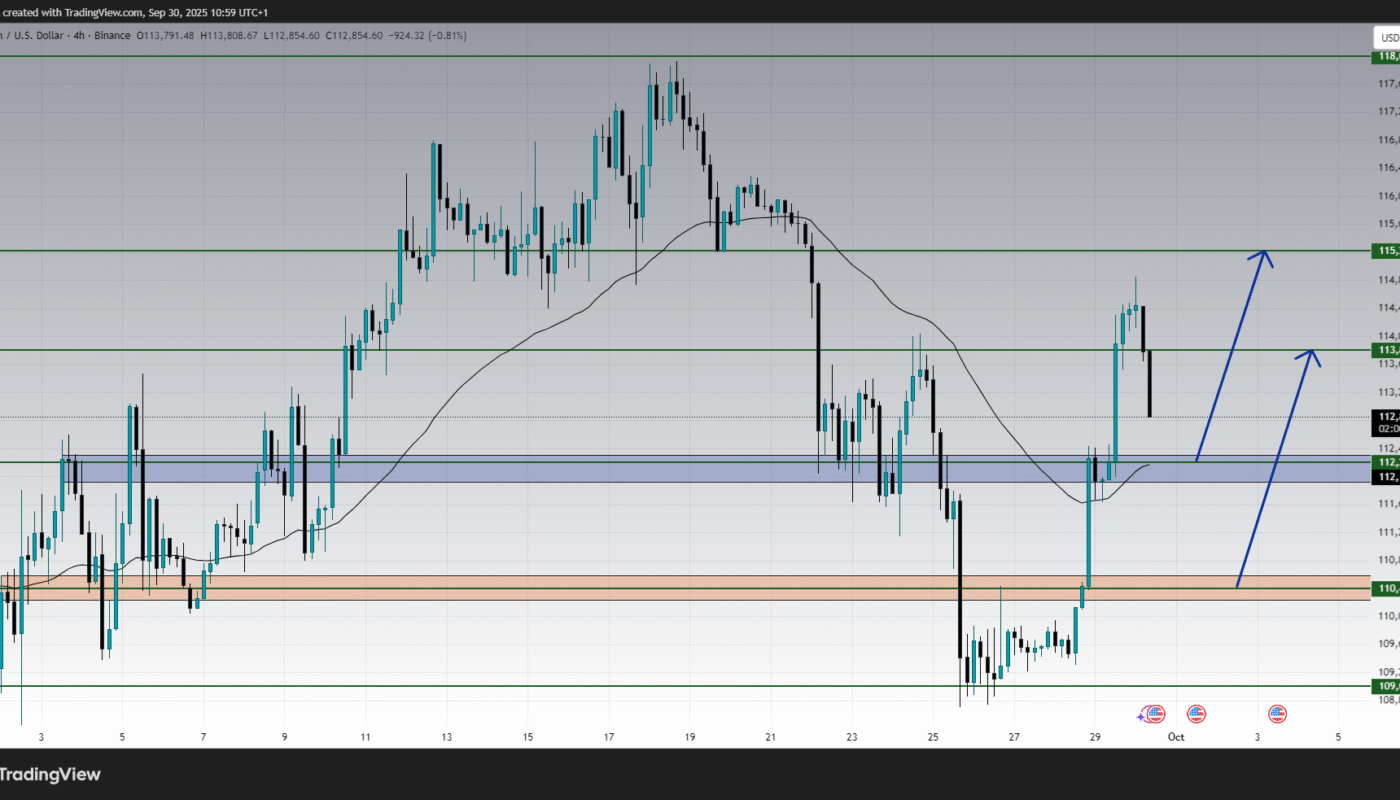
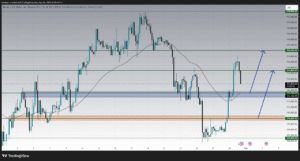
The 4-hour chart provides a clearer view of the bigger picture. Bitcoin’s recovery from the $109,000 bottom shows strong bullish intent, but price action now faces a critical test. The $113,800 zone is the immediate resistance, followed by $115,225 and then the psychological $118,000 mark.
On the downside, the $112,200 area remains a pivotal support. A bounce from this level would keep the bullish structure intact and could fuel another rally toward $115,225. Conversely, a clean break below $112,000 may trigger a deeper retracement, with the next demand area at $110,400.
The moving average also acts as a key guide. As long as Bitcoin trades above it, short-term buyers will likely remain confident.
Momentum Indicators : RSI and Stochastic
Both RSI and Stochastic oscillators point to a cooling phase. On the shorter timeframes, momentum shifted from overbought zones, confirming that a corrective wave is underway. This suggests traders should watch for fresh entries at lower support zones rather than chasing the highs.
When oscillators reset closer to neutral, and if price holds above major supports, the probability of another bullish wave increases. This setup is typical in trending markets, where pullbacks offer opportunities rather than signals of full reversals.
Key Levels to Watch :
-
Immediate Resistance: $113,800 – If broken, BTC may target $115,225.
-
Major Resistance: $115,225 and $118,000 – Strong supply zones where sellers could regroup.
-
Immediate Support: $112,200 – Critical line that decides short-term direction.
-
Secondary Support: $110,400 – If tested, it may attract fresh buying interest.
-
Major Support: $109,000 – The bottom of the recent correction, key for medium-term trend.
Market Sentiment and Fundamentals :
Beyond technical levels, traders should keep an eye on global macroeconomic trends and crypto market sentiment. Recent volatility in Bitcoin often coincides with changes in risk appetite, U.S. dollar strength, and equity market performance. Any updates on monetary policy or macroeconomic data could fuel short-term volatility.
Institutional interest also remains a supportive factor, as Bitcoin continues to establish itself as a hedge against inflation and a long-term store of value. However, traders should balance optimism with caution, as profit-taking phases are common after sharp rallies.
Conclusion :
Bitcoin’s latest price action shows that bulls are regaining control, but resistance at $113,800 and $115,225 is proving difficult to break. As long as BTC holds above $112,200, the outlook remains constructive, and another rally toward $115,000 and $118,000 is possible. On the other hand, failure to hold above support could invite sellers back into the market, pushing prices toward $110,400 and $109,000.
For traders, the strategy remains clear: watch for pullbacks into strong support zones for potential buying opportunities, while keeping an eye on resistance for profit-taking. With momentum indicators signaling a short-term cooldown, the next sessions will be crucial in determining whether Bitcoin resumes its bullish march or consolidates further before the next big move.